U.S. Union Membership Data in Perspective
Every January, the Bureau of Labor Statistics (BLS) publishes union membership figures for the United States.[i] For many decades now, these annual reports have provided a numerical profile of organized labor’s decline. Yet the recent BLS report for 2017 shows a different picture, indicating a rise in unionization, including among young workers. The report is being interpreted by many as a reflection of significant new organizing.[ii] While increased membership figures and density are important, because they are rough measures of workers’ power in an industry or the economy as a whole, I would suggest that we refrain from viewing the uptick in union membership for 2017 as a sign of increased success in union organizing. A closer look at the numbers tells a different story.
Changes in 2017
The BLS in its yearly report presents year-on-year changes.
- Overall membership was up slightly, by 262,000. The increase included 166,000 in the private sector; 96,000 in the public sector.
- Demographically, membership was up among men (+278,000) and down among women (-16,000); among African-Americans membership was essentially unchanged. Latino membership was up for both men (+52,000) and women (+117,000).
- While young workers, 16-24, increased membership by 61,000, their rate of unionization remains by far the lowest of any age group—density is only 4.7 percent. Workers aged 55-64 experienced an increase of 129,000 union members and are the heaviest unionized age cohort, at 13.5 percent.
- Overall density was unchanged. With 14,817,000 union members, overall the BLS puts union density at 10.7 percent—the same as 2016.
- There was a marginal increase in private sector density. The 166,000 increase translated into a density increase from 6.44 percent to 6.50 percent. Overall, public sector density was unchanged, year-on-year, at 34.4 percent.
- Sectorally, private construction (+63,000); manufacturing (+33,000); trade (+59,000); utilities (+27,000); and health care (+25,000) increased. Transportation and warehousing (-32,000) and private-sector education (-34,000) declined.
Interpreting the data
First—the data are compilations from survey questions asked of household members. The main question on unions is, “On this job, are you a member of a labor union or of an employee association similar to a union?” The numbers are often read as an indication of how many workers are joining unions—or of the success of organizing drives. But being represented by a union does not mean there was a successful organizing drive. Results of NLRB supervised union elections bear this out: In fiscal 2017, only 79,750 workers were eligible in representation elections; only 37,631 voted for unionization.[iii] These data do not consider the perennial challenge of gaining a first contract, which is a necessary step in the unionization process under current law. Granted, some union organizing drives are conducted outside the NLRB process; and public sector campaign data is collected on a state-by-state basis. It seems clear that the additional 262,000 employees reporting that they are working union is not a direct consequence of organizing campaigns, but largely the result of new jobs added in already unionized workplaces.
In this way, unionization data is tied not only to organizing, but significantly to the condition of the economy and to hiring patterns in unionized sectors.. When a unionized manufacturing firm adds workers or a whole shift, unionization figures rise. Similarly, when unionized construction contractors hire new workers, membership can increase without a great deal of new organizing. Conversations with organizers across the labor movement confirm this—in construction, manufacturing, trade and the public sector, organizers familiar with their own unions’ organizing efforts cannot account for the BLS increases solely on the basis of their own organizing campaigns.
Second—the news releases show only year-on-year trends. It is foolhardy to draw systematic conclusions from annual numbers. Longer term trends offer a more balanced—if sobering—membership portrait of organized labor. Fortunately, this data is readily accessible at the excellent website, unionstats.com, maintained by professors Barry Hirsch and David Macpherson.[iv]
Some analysts of the January 2018 BLS press release highlighted the growth of unionization among younger workers. Between 2016 and 2017, unionization among workers aged 16 to 34 increased by 198,000, growing to 3,938,000 (density 7.70 percent). Unfortunately, data for a decade ago—when the economy was heating up before the great recession—show greater growth, membership and density. Between 2006 and 2007, unionization increased among workers aged 16-34 by 233,000, growing to 3,989,000 (density 8.17 percent). Frame of reference matters.
Union membership and density, United States, selected sectors, 1987-2017


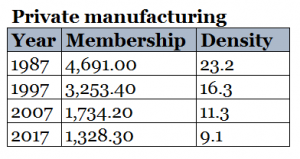

Source: Barry Hirsch and David Macpherson, Union membership and coverage database from the CPS [Current Population Survey], at unionstats.com (acc. February 20, 2018).
The U.S., as a part of the world economy, has undergone fundamental transformations over the course of the past generation. Geographically, production has shifted both within and beyond U.S. borders. New labor-saving technologies have been introduced in many industries. Politically—at the national and state levels—circumstances have often been unfavorable for organized labor. These transformations have thrown organized labor onto the defensive, especially in private sector industries that had long been strongholds of the movement. This has resulted in labor’s inability to alter the downward course of membership and density figures.
At the same time, the long-term numbers show that public sector density has kept pace with the expansion of the state. Within the overall figures, there has been systematic upward movement in density in the public sector in a handful of states with relatively favorable legal context and active organizing programs. Public sector density has increased significantly in Washington, California, Texas, Illinois, Vermont, Connecticut, New Hampshire, New Jersey in the three decades since 1987. Meanwhile, unsurprisingly, where public sector labor law grew unfavorable, in states like Wisconsin, for example, density fell dramatically. Is it any wonder that anti-union conservatives are targeting public sector workers, as in the Janus v. AFSCME case currently before the U.S. Supreme Court?
Union organizations that have built up robust internal organizing programs, that are dedicated to member involvement in external organizing, and that have been able to build alliances with their wider community have been able to resist anti-union employer efforts. Unions’ ability to transform quantitative capacity into qualitative power, through such member mobilization and alliance building, has often spelled the difference between victory and defeat in being able to defend union wages and working conditions.
The BLS figures—particularly in the longitudinal Hirsch/Macpherson compilation—can be broken down by sector and geography to portray dramatically the decline in density and membership over the past decades. Organizers can use such figures to help make the case for new organizing. But the new BLS numbers should not serve as cause for celebration, but rather an indication of the continued need for aggressive organizing, especially in light of the pending Janus v. AFSCME decision likely to bring a steep decline in public sector unionization.
Notes
[i] U.S. Department of Labor, Bureau of Labor Statistics, News Release, “Union Members—2017,” January 18, 2018, at https://www.bls.gov/news.release/pdf/union2.pdf (accessed February 20, 2018).
[ii] Eli Day, “The economic outlook for millennials is bleak. Now they’re unionizing in record numbers,” Mother Jones, February 9, 2018, at https://www.motherjones.com/politics/2018/02/millennials-survived-the-financial-crisis-now-theyre-unionizing-in-record-numbers/ (acc. February 10, 2018); Michelle Chen, “Millennials are keeping unions alive,” The Nation, February 5, 2018, at https://www.thenation.com/article/millennials-are-keeping-unions-alive/ (acc. February 10, 2018).
[iii] National Labor Relations Board, “Election report for cases closed,” October 16, 2017, at https://www.nlrb.gov/sites/default/files/attachments/basic-page/node-4751/Total%20Cases%20Closed%20-%20FY%202017.pdf (acc. February 20, 2018).
[iv] Hirsch and Macpherson’s longitudinal presentation, which breaks down membership and density by sector and geographically, can be especially useful in developing a portrait that organizers can use to boost support for organizing campaigns.